The Events section in Splashtop Secure Workspace allows you to access detailed logs of events happening across your workspace environment. This provides valuable insights into user activities and system events, enabling you to monitor and troubleshoot issues effectively. Let's explore the different sections in the Events tab.
Filter Section
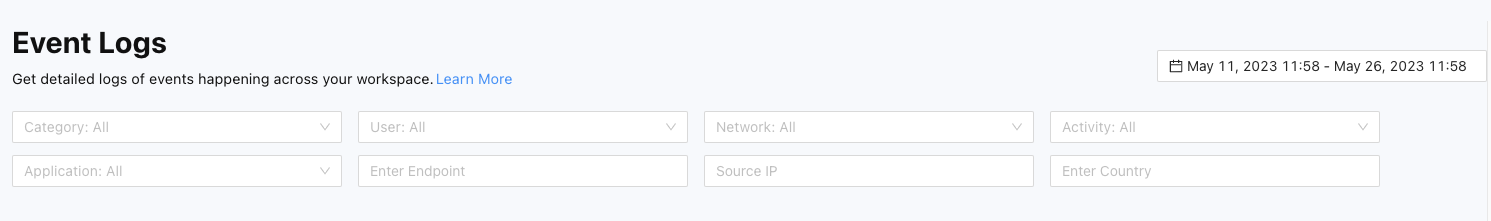
The Filter section allows you to refine the event logs displayed on the page. You can adjust the time range using the time picker and apply column-based filters to modify the content shown. By selecting specific criteria, you can narrow down the event logs to focus on relevant information.
Histogram
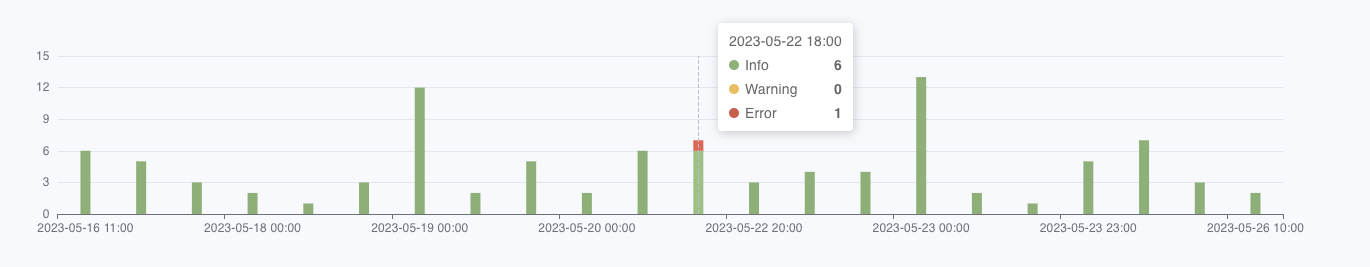
The Histogram is a visual representation of the event logs over time. It presents a time-series bar chart that reflects the data after applying the filters set in the Filter section. Informational logs are denoted in green, warnings in yellow, and errors in red. You can adjust the time range by dragging the histogram to the desired period.
Table
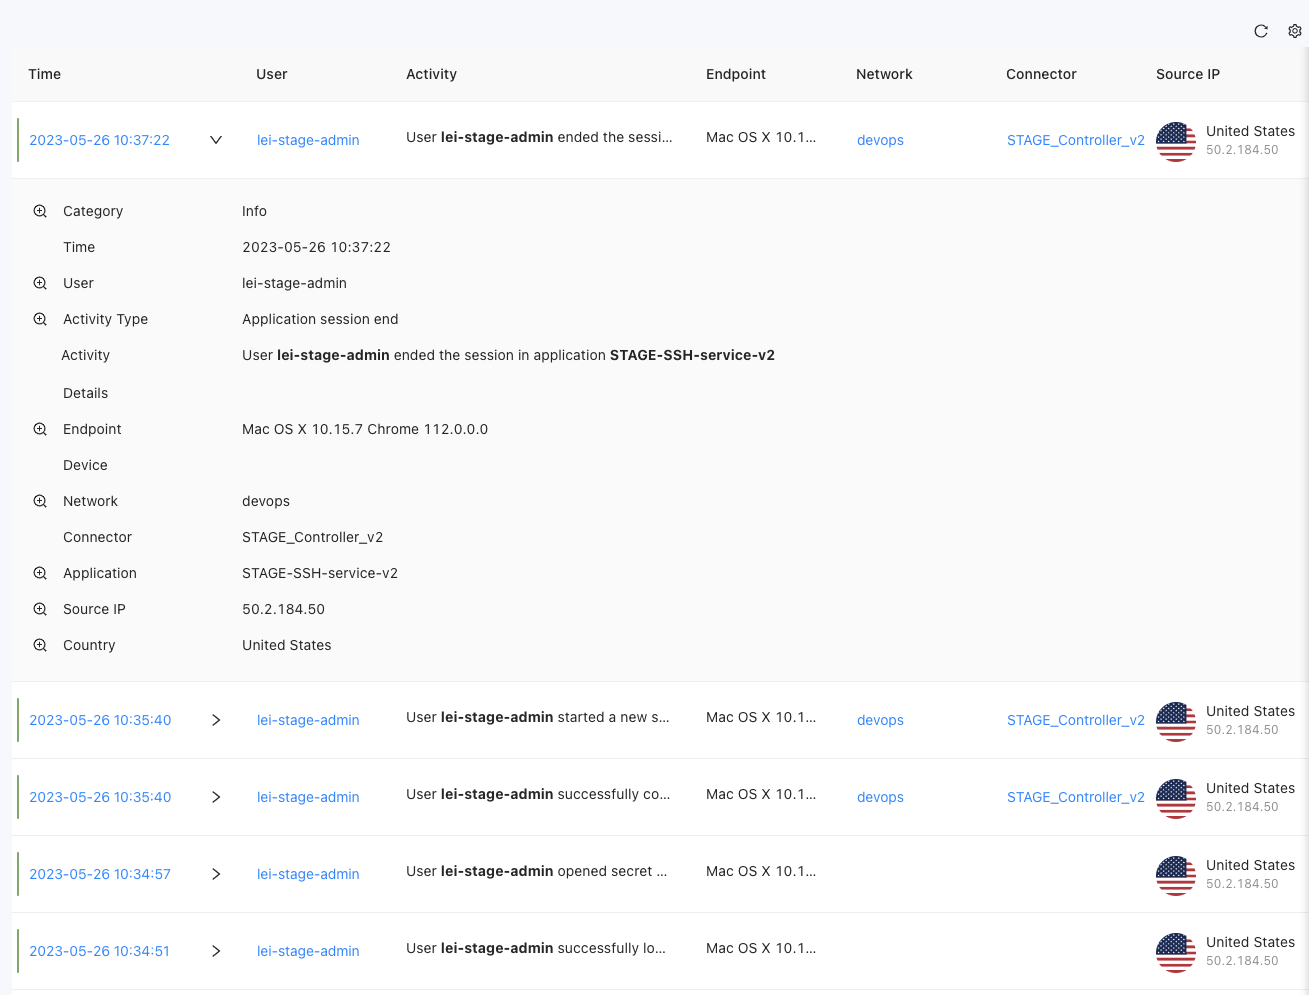
The Table displays detailed event log information in a tabular format. You have the flexibility to customize the columns displayed by clicking the Table Settings button. By expanding the ">" button within the table, you can view the detailed information of each log entry. Additionally, you can quickly add or remove any column value from the filter by clicking the magnifying glass icon located in front of it, allowing for efficient log exploration and analysis.
The Events section provides a comprehensive view of event logs in Splashtop Secure Workspace. With the ability to filter logs based on time, apply column-based filters, and analyze logs using the histogram and table views, you can effectively monitor and investigate events within your workspace environment.